Chapter 8 NHST
Following the traditional NHST approach, we consider the model previously defined that includes all effects of interest (gender effect and the interaction between mother attachment and father attachment). Results of the analysis of deviance are reported below.
car::Anova(fit_int_zinb)
## Analysis of Deviance Table (Type II Wald chisquare tests)
##
## Response: internalizing_sum
##                 Chisq Df Pr(>Chisq)
## gender         0.9449  1   0.331015
## mother        12.4302  3   0.006046 **
## father         2.6855  3   0.442698
## mother:father  9.6213  9   0.382006
## ---
## Signif. codes:  0 '***' 0.001 '**' 0.01 '*' 0.05 '.' 0.1 ' ' 1
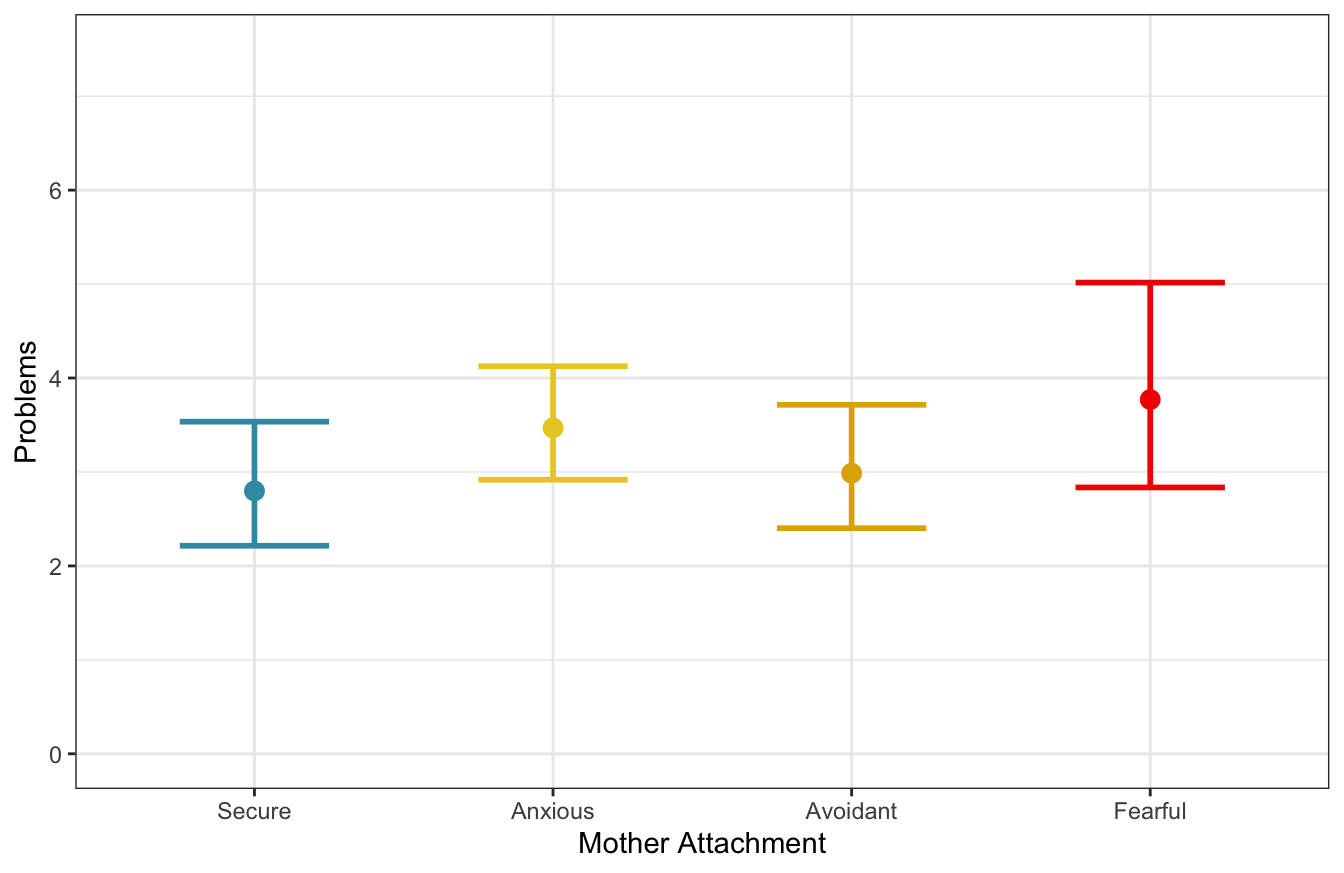
Results indicate only a statistically significant effect of mother attachment. On the contrary, the interaction and father attachment are not significant. The model summary is reported below.
summary(fit_int_zinb)
##  Family: nbinom2  ( log )
## Formula:          internalizing_sum ~ gender + mother * father + (1 | ID_class)
## Zero inflation:                     ~gender + (1 | ID_class)
## Data: data_cluster
##
##      AIC      BIC   logLik deviance df.resid
##   3669.0   3773.3  -1812.5   3625.0      825
##
## Random effects:
##
## Conditional model:
##  Groups   Name        Variance Std.Dev.
##  ID_class (Intercept) 0.1364   0.3693
## Number of obs: 847, groups:  ID_class, 50
##
## Zero-inflation model:
##  Groups   Name        Variance Std.Dev.
##  ID_class (Intercept) 3.225    1.796
## Number of obs: 847, groups:  ID_class, 50
##
## Dispersion parameter for nbinom2 family ():  2.6
##
## Conditional model:
##                               Estimate Std. Error z value Pr(>|z|)
## (Intercept)                    0.85592    0.12115   7.065 1.61e-12 ***
## genderM                        0.06854    0.07051   0.972  0.33101
## motherAnxious                  0.47960    0.16672   2.877  0.00402 **
## motherAvoidant                -0.08057    0.24671  -0.327  0.74398
## motherFearful                  0.66801    0.41101   1.625  0.10410
## fatherAnxious                  0.07410    0.16668   0.445  0.65661
## fatherAvoidant                 0.09901    0.17349   0.571  0.56822
## fatherFearful                  0.38182    0.33578   1.137  0.25550
## motherAnxious:fatherAnxious   -0.26373    0.23441  -1.125  0.26055
## motherAvoidant:fatherAnxious   0.25023    0.30643   0.817  0.41416
## motherFearful:fatherAnxious   -0.80565    0.50634  -1.591  0.11158
## motherAnxious:fatherAvoidant  -0.25807    0.23926  -1.079  0.28076
## motherAvoidant:fatherAvoidant  0.10204    0.30109   0.339  0.73467
## motherFearful:fatherAvoidant  -0.25422    0.46295  -0.549  0.58292
## motherAnxious:fatherFearful   -0.53674    0.39927  -1.344  0.17885
## motherAvoidant:fatherFearful   0.23131    0.47623   0.486  0.62718
## motherFearful:fatherFearful   -0.41834    0.54125  -0.773  0.43958
## ---
## Signif. codes:  0 '***' 0.001 '**' 0.01 '*' 0.05 '.' 0.1 ' ' 1
##
## Zero-inflation model:
##             Estimate Std. Error z value Pr(>|z|)
## (Intercept)  -2.6112     0.6183  -4.223 2.41e-05 ***
## genderM      -0.2890     0.3531  -0.818    0.413
## ---
## Signif. codes:  0 '***' 0.001 '**' 0.01 '*' 0.05 '.' 0.1 ' ' 1
Figure 8.1: Marginal predicted values according to mother attachment. Values are averaged over the other effects (\(n_{subj} = 847\)).
Post-hoc tests are run to evaluate differences between mother attachment styles, considering pairwise comparisons and adjusting p-values according to multivariate t-distribution. Results are reported below,
emmeans::contrast(emmeans::emmeans(fit_int_zinb, specs = ~ mother ),
                  "pairwise", adjust = "mvt")
## NOTE: Results may be misleading due to involvement in interactions
##  contrast           estimate    SE  df t.ratio p.value
##  Secure - Anxious    -0.2150 0.117 825  -1.836  0.2510
##  Secure - Avoidant   -0.0653 0.136 825  -0.481  0.9622
##  Secure - Fearful    -0.2985 0.166 825  -1.793  0.2708
##  Anxious - Avoidant   0.1496 0.112 825   1.336  0.5321
##  Anxious - Fearful   -0.0835 0.147 825  -0.566  0.9403
##  Avoidant - Fearful  -0.2331 0.164 825  -1.423  0.4774
##
## Results are averaged over the levels of: gender, father
## Results are given on the log (not the response) scale.
## P value adjustment: mvt method for 6 tests
After adjusting p-values we actually get that there are no statistically significant differences. Without adjusting, the difference between Anxious and Secure children and the difference between Fearful and Secure children have a low (but not statistically significant) p-value.
emmeans::contrast(emmeans::emmeans(fit_int_zinb, specs = ~ mother ),
                  "pairwise", adjust = NULL)
## NOTE: Results may be misleading due to involvement in interactions
##  contrast           estimate    SE  df t.ratio p.value
##  Secure - Anxious    -0.2150 0.117 825  -1.836  0.0668
##  Secure - Avoidant   -0.0653 0.136 825  -0.481  0.6307
##  Secure - Fearful    -0.2985 0.166 825  -1.793  0.0734
##  Anxious - Avoidant   0.1496 0.112 825   1.336  0.1818
##  Anxious - Fearful   -0.0835 0.147 825  -0.566  0.5713
##  Avoidant - Fearful  -0.2331 0.164 825  -1.423  0.1551
##
## Results are averaged over the levels of: gender, father
## Results are given on the log (not the response) scale.
To evaluate the fit of the model to the data, we computed the Marginal \(R^2\) and the Conditional \(R^2\).
performance::r2(fit_int_zinb)
## Warning: mu of 3.2 is too close to zero, estimate of random effect variances may be unreliable.
## # R2 for Mixed Models
##
##   Conditional R2: 0.217
##      Marginal R2: 0.047
We can see that the actual variance explained by fixed effects is less than 5%, not that much.
Conclusions
Results are difficult to interpret because we have a statistically significant effect of mother attachment, but, considering pot-hoc tests, we get no statistically significant difference. Overall, we could say that, in some way, results indicate a role of mother attachment but this probably is small.