Chapter 10 Bayes Factor
10.1 Encompassing Model
We define a Zero-Inflated Negative Binomial (ZINB) mixed-effects considering only the role of gender as a fixed effect and children’s classroom ID as a random effect for \(p\). Whereas, regarding \(\mu\), we consider the interaction between mother and father attachment together with gender as fixed effects and children’s classroom ID as a random effect. In the R formula syntax, we have
# formula for p
p ~ gender + (1|ID_class)

# formula for mu
mu ~ gender + mother * father + (1|ID_class)
10.1.1 Prior Choice
We set the same prior as for the externalizing problems analysis. The resulting prior settings are
##                   prior     class                          coef    group resp dpar nlpar lb ub       source
##            normal(0, 3)         b                                                                      user
##            normal(0, 3)         b                 fatherAnxious                                (vectorized)
##            normal(0, 3)         b                fatherAvoidant                                (vectorized)
##            normal(0, 3)         b                 fatherFearful                                (vectorized)
##            normal(0, 3)         b                       genderM                                (vectorized)
##            normal(0, 3)         b                 motherAnxious                                (vectorized)
##            normal(0, 3)         b   motherAnxious:fatherAnxious                                (vectorized)
##            normal(0, 3)         b  motherAnxious:fatherAvoidant                                (vectorized)
##            normal(0, 3)         b   motherAnxious:fatherFearful                                (vectorized)
##            normal(0, 3)         b                motherAvoidant                                (vectorized)
##            normal(0, 3)         b  motherAvoidant:fatherAnxious                                (vectorized)
##            normal(0, 3)         b motherAvoidant:fatherAvoidant                                (vectorized)
##            normal(0, 3)         b  motherAvoidant:fatherFearful                                (vectorized)
##            normal(0, 3)         b                 motherFearful                                (vectorized)
##            normal(0, 3)         b   motherFearful:fatherAnxious                                (vectorized)
##            normal(0, 3)         b  motherFearful:fatherAvoidant                                (vectorized)
##            normal(0, 3)         b   motherFearful:fatherFearful                                (vectorized)
##                  (flat)         b                                               zi                  default
##                  (flat)         b                       genderM                 zi             (vectorized)
##  student_t(3, 0.7, 2.5) Intercept                                                                   default
##          logistic(0, 1) Intercept                                               zi                  default
##    student_t(3, 0, 2.5)        sd                                                         0         default
##    student_t(3, 0, 2.5)        sd                                               zi        0         default
##    student_t(3, 0, 2.5)        sd                               ID_class                  0    (vectorized)
##    student_t(3, 0, 2.5)        sd                     Intercept ID_class                  0    (vectorized)
##    student_t(3, 0, 2.5)        sd                               ID_class        zi        0    (vectorized)
##    student_t(3, 0, 2.5)        sd                     Intercept ID_class        zi        0    (vectorized)
##       gamma(0.01, 0.01)     shape                                                         0         default
10.1.2 Posterior
The encompassing model is estimated using 6 independent chains with 10,000 iterations (warm-up 2,000). Summary of the encompassing model is presented below.
##  Family: zero_inflated_negbinomial
##   Links: mu = log; shape = identity; zi = logit
## Formula: internalizing_sum ~ gender + mother * father + (1 | ID_class)
##          zi ~ gender + (1 | ID_class)
##    Data: data (Number of observations: 847)
##   Draws: 6 chains, each with iter = 10000; warmup = 2000; thin = 1;
##          total post-warmup draws = 48000
##
## Group-Level Effects:
## ~ID_class (Number of levels: 50)
##                  Estimate Est.Error l-95% CI u-95% CI Rhat Bulk_ESS Tail_ESS
## sd(Intercept)        0.44      0.08     0.29     0.62 1.00     9576    21295
## sd(zi_Intercept)     2.24      0.55     1.38     3.53 1.00    23180    29061
##
## Population-Level Effects:
##                               Estimate Est.Error l-95% CI u-95% CI Rhat Bulk_ESS Tail_ESS
## Intercept                         0.83      0.13     0.57     1.08 1.00    20193    31209
## zi_Intercept                     -2.93      0.69    -4.54    -1.84 1.00    23885    24649
## genderM                           0.07      0.07    -0.07     0.22 1.00    69024    39479
## motherAnxious                     0.46      0.17     0.14     0.78 1.00    28713    34928
## motherAvoidant                   -0.08      0.25    -0.56     0.41 1.00    27088    33529
## motherFearful                     0.63      0.40    -0.13     1.44 1.00    25396    29183
## fatherAnxious                     0.07      0.17    -0.26     0.40 1.00    32754    37880
## fatherAvoidant                    0.08      0.18    -0.26     0.43 1.00    33099    33066
## fatherFearful                     0.36      0.34    -0.29     1.04 1.00    27438    31863
## motherAnxious:fatherAnxious      -0.24      0.23    -0.70     0.22 1.00    27476    35909
## motherAvoidant:fatherAnxious      0.24      0.31    -0.37     0.84 1.00    26127    33090
## motherFearful:fatherAnxious      -0.75      0.50    -1.75     0.22 1.00    27653    33582
## motherAnxious:fatherAvoidant     -0.23      0.24    -0.70     0.23 1.00    28023    34471
## motherAvoidant:fatherAvoidant     0.11      0.30    -0.48     0.70 1.00    24526    32104
## motherFearful:fatherAvoidant     -0.18      0.45    -1.10     0.68 1.00    25043    31079
## motherAnxious:fatherFearful      -0.46      0.40    -1.25     0.31 1.00    26068    32120
## motherAvoidant:fatherFearful      0.29      0.48    -0.66     1.22 1.00    26407    35222
## motherFearful:fatherFearful      -0.35      0.53    -1.41     0.67 1.00    22713    30152
## zi_genderM                       -0.31      0.41    -1.12     0.49 1.00    49631    32918
##
## Family Specific Parameters:
##       Estimate Est.Error l-95% CI u-95% CI Rhat Bulk_ESS Tail_ESS
## shape     2.47      0.32     1.90     3.17 1.00    36269    34308
##
## Draws were sampled using sampling(NUTS). For each parameter, Bulk_ESS
## and Tail_ESS are effective sample size measures, and Rhat is the potential
## scale reduction factor on split chains (at convergence, Rhat = 1).
10.2 Hypothesis Matrices
Hypothesis matrices are the same as in the analysis of the externalizing problems.
10.3 Centering and Adjusting
Centering and adjusting procedures are the same as in the analysis of the externalizing problems.
10.4 Results and Sensitivity
Bayes factor and posterior probability of each hypothesis are reported in Table~10.1.
| Hypothesis | Bayes Factor | Posterior Probability | |
|---|---|---|---|
| Null | 3.4e+11 | 0.04 |
|
| Monotropy | 8.8e+12 | 0.91 |
|
| Hierarchy | 4.8e+11 | 0.05 |
|
| Independence | 1.1e+10 | 0.00 |
|
| Integration | 1.8e+10 | 0.00 |
|
Prior sensitivity analysis is conducted considering the same prior as in the analysis of the externalizing problems. The results of the prior sensitivity analysis are reported in Table~10.2.
| Hypothesis | BF | PP | BF | PP | BF | PP | BF | PP | BF | PP |
|---|---|---|---|---|---|---|---|---|---|---|
| Null | 4.4e+01 | 0.00 | 8.4e+04 | 0.00 | 3.4e+11 | 0.04 | 6.8e+14 | 0.09 | 1.9e+19 | 0.27 |
| Monotropy | 2.2e+04 | 0.28 | 1.9e+07 | 0.64 | 8.8e+12 | 0.91 | 6.5e+15 | 0.89 | 5.0e+19 | 0.72 |
| Hierarchy | 4.0e+04 | 0.52 | 9.0e+06 | 0.29 | 4.8e+11 | 0.05 | 1.2e+14 | 0.02 | 2.2e+17 | 0.00 |
| Independence | 5.8e+03 | 0.07 | 6.4e+05 | 0.02 | 1.1e+10 | 0.00 | 1.6e+12 | 0.00 | 1.6e+15 | 0.00 |
| Integration | 1.0e+04 | 0.13 | 1.5e+06 | 0.05 | 1.8e+10 | 0.00 | 1.6e+12 | 0.00 | 8.2e+14 | 0.00 |
Overall results consistently indicate the Monotropy Hypothesis as the most supported by the data. However, we can observe the same patterns as in the analysis of the externalizing problems. More diffuse prior, favour hypothesis with more equality constraints. Whereas, tighter prior penalizes hypotheses with more equality constraints.
10.5 Selected Model
In the model, we consider only the role of gender and mother attachment as fixed effects of \(\mu\). In the R formula syntax, we have
# formula for p
p ~ gender + (1|ID_class)

# formula for mu
mu ~ gender + mother + (1|ID_class)
Again, we specify the same prior distributions as before. The resulting prior settings are
##                   prior     class           coef    group resp dpar nlpar lb ub       source
##            normal(0, 3)         b                                                       user
##            normal(0, 3)         b        genderM                                (vectorized)
##            normal(0, 3)         b  motherAnxious                                (vectorized)
##            normal(0, 3)         b motherAvoidant                                (vectorized)
##            normal(0, 3)         b  motherFearful                                (vectorized)
##                  (flat)         b                                zi                  default
##                  (flat)         b        genderM                 zi             (vectorized)
##  student_t(3, 0.7, 2.5) Intercept                                                    default
##          logistic(0, 1) Intercept                                zi                  default
##    student_t(3, 0, 2.5)        sd                                          0         default
##    student_t(3, 0, 2.5)        sd                                zi        0         default
##    student_t(3, 0, 2.5)        sd                ID_class                  0    (vectorized)
##    student_t(3, 0, 2.5)        sd      Intercept ID_class                  0    (vectorized)
##    student_t(3, 0, 2.5)        sd                ID_class        zi        0    (vectorized)
##    student_t(3, 0, 2.5)        sd      Intercept ID_class        zi        0    (vectorized)
##       gamma(0.01, 0.01)     shape                                          0         default
The model is estimated using 6 independent chains with 6,000 iterations (warm-up 2,000). The model summary is presented below.
##  Family: zero_inflated_negbinomial
##   Links: mu = log; shape = identity; zi = logit
## Formula: internalizing_sum ~ gender + mother + (1 | ID_class)
##          zi ~ gender + (1 | ID_class)
##    Data: data (Number of observations: 847)
##   Draws: 6 chains, each with iter = 6000; warmup = 2000; thin = 1;
##          total post-warmup draws = 24000
##
## Group-Level Effects:
## ~ID_class (Number of levels: 50)
##                  Estimate Est.Error l-95% CI u-95% CI Rhat Bulk_ESS Tail_ESS
## sd(Intercept)        0.43      0.08     0.29     0.61 1.00     4981    11555
## sd(zi_Intercept)     2.17      0.53     1.34     3.40 1.00    12787    16150
##
## Population-Level Effects:
##                Estimate Est.Error l-95% CI u-95% CI Rhat Bulk_ESS Tail_ESS
## Intercept          0.89      0.11     0.66     1.10 1.00    10532    14506
## zi_Intercept      -2.81      0.65    -4.31    -1.79 1.00    14230    13767
## genderM            0.07      0.07    -0.07     0.21 1.00    38142    19994
## motherAnxious      0.29      0.09     0.11     0.46 1.00    27686    19778
## motherAvoidant     0.12      0.10    -0.07     0.31 1.00    30305    18855
## motherFearful      0.48      0.12     0.25     0.71 1.00    28322    20529
## zi_genderM        -0.29      0.39    -1.07     0.48 1.00    27658    17214
##
## Family Specific Parameters:
##       Estimate Est.Error l-95% CI u-95% CI Rhat Bulk_ESS Tail_ESS
## shape     2.53      0.33     1.95     3.26 1.00    21194    18858
##
## Draws were sampled using sampling(NUTS). For each parameter, Bulk_ESS
## and Tail_ESS are effective sample size measures, and Rhat is the potential
## scale reduction factor on split chains (at convergence, Rhat = 1).
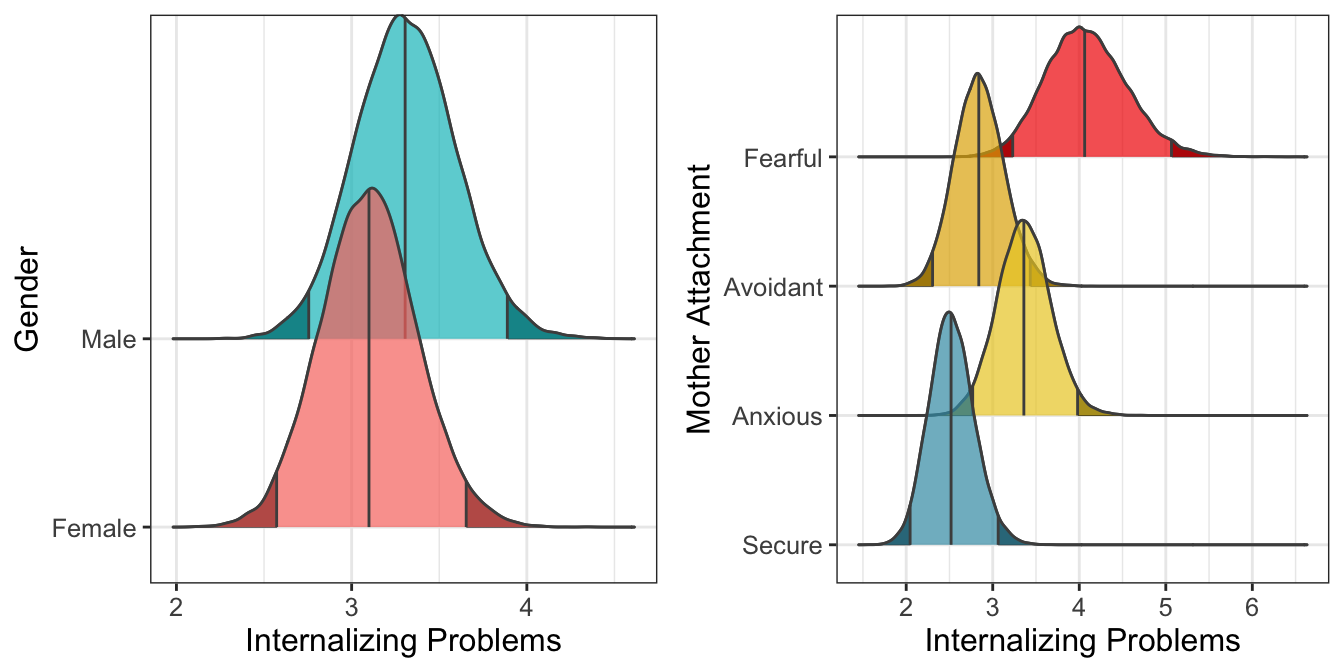
Figure 10.1: Marginal predicted values according to gender and mother attachment (\(n_{subj} = 847\)).

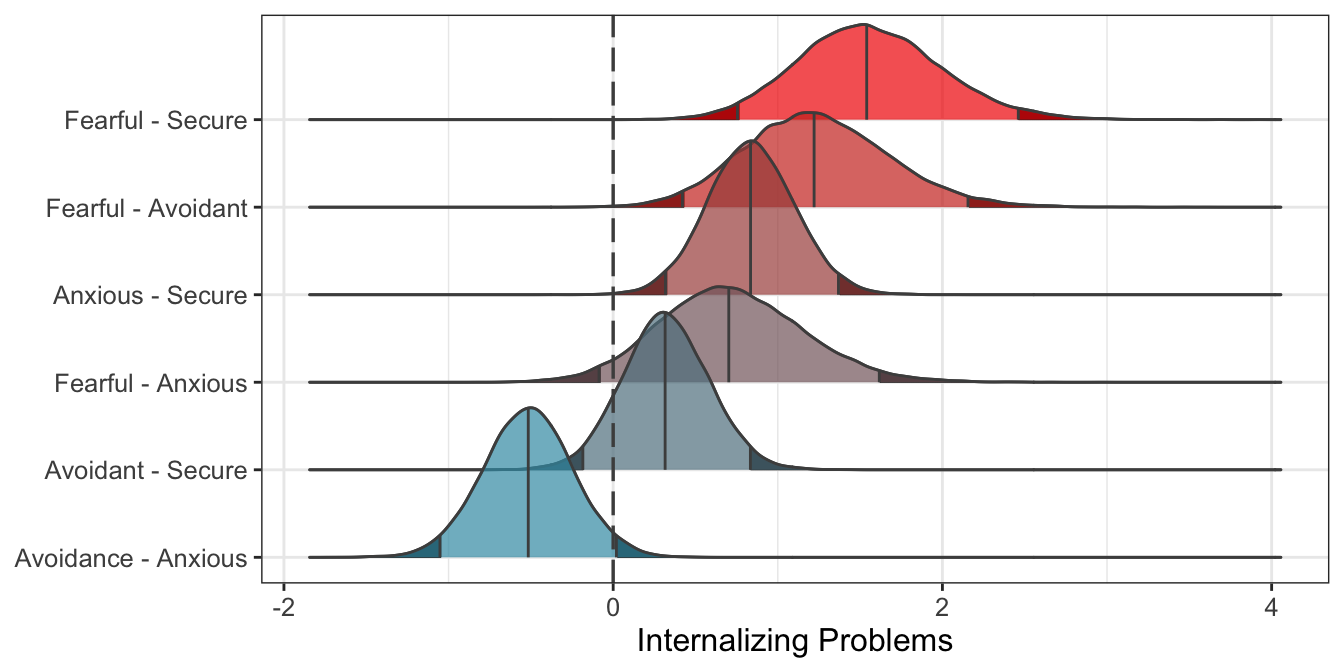
Figure 10.2: Predicted differences between mother attachment patterns (\(n_{subj} = 847\)).
Overall, results indicate that Fearful, and Anxious children have more problems than Secure children. Moreover, Fearful children have more problems than Avoidant children. Finally, also the difference between Avoidant and Anxious children is close to the threshold.
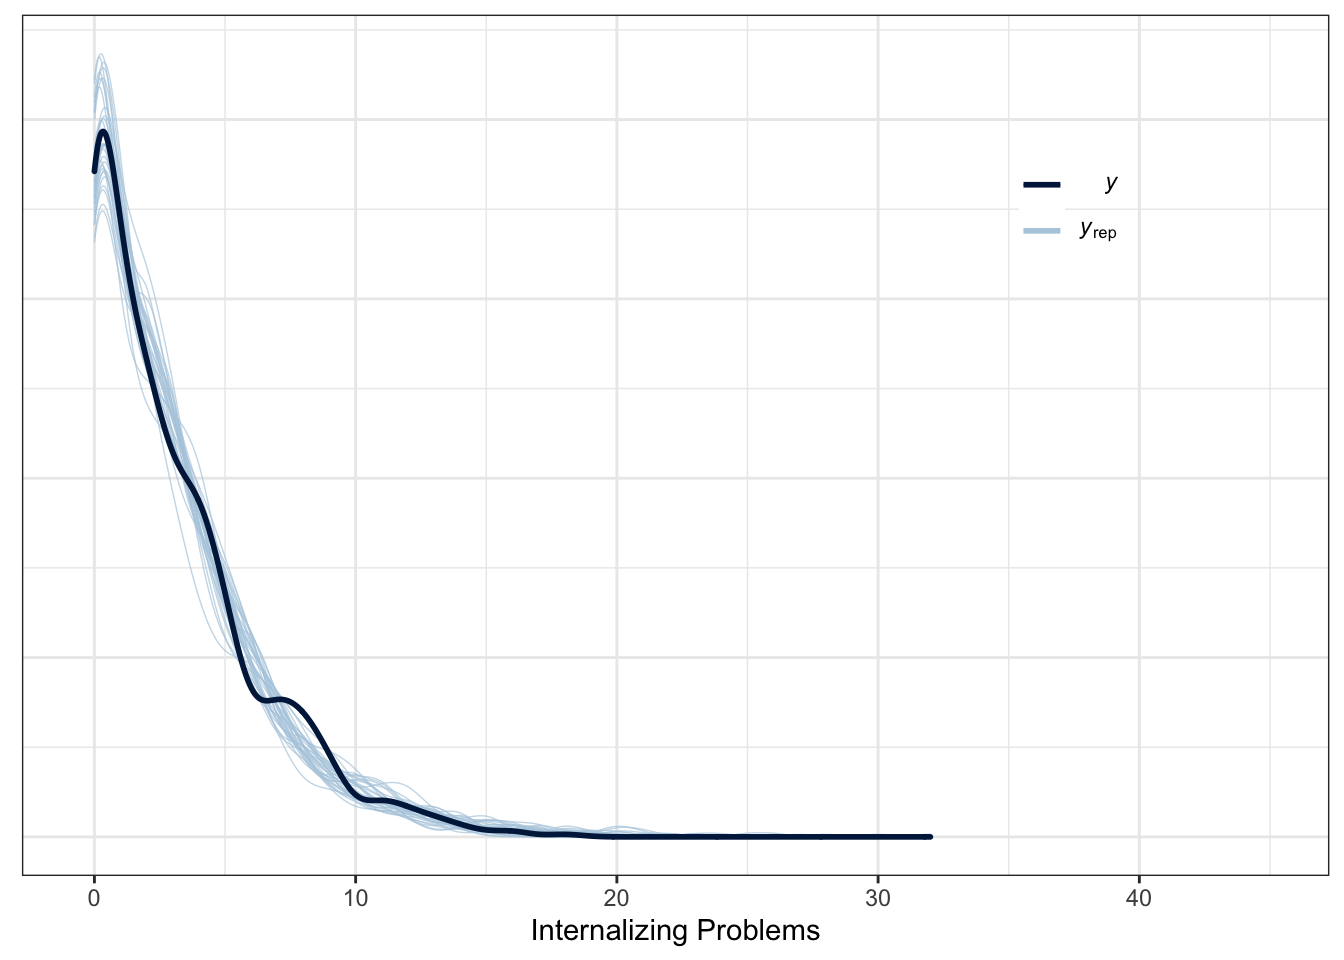
To evaluate the fit of the model to the data, we computed the Bayesian \(R^2\) using the function brms::bayes_R2(), and we present Posterior Predictions in Figure~10.3.
r2_int
##     Estimate  Est.Error      Q2.5     Q97.5
## R2 0.2224078 0.02975503 0.1660707 0.2825445
Figure 10.3: Posterior predictive check (\(n_{subj} = 847\)).
We can see that the actual variance explained by fixed effects and random effects is around 22%. Moreover, the posterior predictive check indicates a good fit to the data.